Geocomputation with R: Chapter 8 - Making map with R teaches how to make maps with various packages with R. Most of the methods are easy to learn if you read this chapter carefully and try to use these packages. Here I didn’t want to follow the book, but making my own map instead. Firstly I want to make a map of China with borders of each province. Then I want to creat a map of higher education level across China.
第八章 Geocomputation with R: Chapter 8 - Making map with R 讲解了一系列地图制作方法,很多 R 程辑包都能完成这些制图操作。这里不再跟随书本,而是试图根据搜集的简单数据,在练习使用 R 制作地图的同时,融汇综合前面学过的关于地图计算的概念和方法,解决一些简单的实际问题。比如,这里即是将中国高等学校数量分布状况进行简单分析,由此,即可了解中国高等教育水平在不同地区的分布情况。
Map of China
Firstly, the map of China can be made. Attention that a lot of R packages regard Taiwan as an indipendent region seperated from China in data. This is not acceptable for every Chinese people. But so far, I have to combine them together manually. Maybe there are other more simple methods to do this. If you know, you can kindly tell me.
首先要做的是输出完整的中国地图。很多 R 包仍将台湾列为单独的地理数据,并没有将其与中国大陆合并在一起。来,抗议抗议!台湾是中国不可分割的一部分!因此目前为止,只有手动将其合并,可能使用的方法不是最简单的。如果你有更简单方便的办法,可以告诉我。
library(sf)
library(raster)
library(spData)
library(tmap)
library(rnaturalearth)
library(dplyr)
# China
cn1 <- ne_states(country = 'china')
cn1_sf <- st_as_sf(cn1)
cn_sf_g <- cn1_sf[, "name"]
# Add Taiwan
tw <- ne_states(country="Taiwan")
tw_sf <- st_as_sf(tw[, "name"]) %>% st_union() %>% st_sf()
tw_sf_g <- cbind(name = "Taiwan", tw_sf)
# The geometry type of object tw_sf_g is POLYGON
# rbind and cast to "MULTIPOLYGON"
cn_geometry <- rbind(cn_sf_g, tw_sf_g) %>% st_cast("MULTIPOLYGON")
cn_geometry
# Simple feature collection with 33 features and 1 field
# geometry type:  GEOMETRY
# dimension:      XY
# bbox:           xmin: 73.60226 ymin: 15.77538 xmax: 134.7726 ymax: 53.56944
# epsg (SRID):    4326
# proj4string:    +proj=longlat +datum=WGS84 +no_defs
# First 10 features:
#              name                       geometry
# 17       Xinjiang MULTIPOLYGON (((78.95694 34...
# 18         Xizang MULTIPOLYGON (((78.38098 32...
# 117  Inner Mongol MULTIPOLYGON (((116.582 46....
# 123         Gansu MULTIPOLYGON (((96.36634 42...
# 260        Yunnan MULTIPOLYGON (((102.1187 22...
# 999  Heilongjiang MULTIPOLYGON (((123.2773 53...
# 1004        Jilin MULTIPOLYGON (((131.2528 43...
# 1009     Liaoning MULTIPOLYGON (((125.7041 40...
# 1269      Guangxi MULTIPOLYGON (((105.665 23....
# 1669    Guangdong MULTIPOLYGON (((114.2298 22...

# plot the map
plot(cn_geometry, main = "China, plot()")
# Using tmap package to make map
tm_shape(cn_sf_g) + tm_borders(col="white", lwd=0.3) + tm_fill(col="red", alpha=0.5)
   + tm_shape(tw_sf) + tm_borders(col="white", lwd=0.3) + tm_fill(col="red", alpha=0.5)
   + tm_layout(title = "China, tmap")

Distribution of higher education level across China
Overview
For simplify the question, I just use the number of universities in each province of China to represent the higher education level. The data are from 2019年全国高等学校名单 and 中国各省概况. Usually, colleges in China include universities of banchelor and colleges of specialist, and the former is much better than the latter in normal people’s thinking. The competation of entering these universities are very serious in China. So here I use the number of universities (Banchelor) to point the difference among provinces. Finally, I combine the number of universities in each province of China with the geometry of China .
为了简化问题,这里仅取中国各省大学的数量,作为衡量高等教育水平的指标。高校数据来自教育部网站 2019年全国高等学校名单 ,这里仅将全国高校分为本科和专科。当然了,一般来说大家都觉得本科比专科更好,因此就目前来讲,可以说本科大学的数量,才是真正代表某一省份或地区的高等教育水平。另外,各省面积、人口数据来自百度百科 中国各省概况 。
univ_data <- read.csv("~/Desktop/ye/university_in_cn.csv", head = TRUE, sep=";")
univ_data
#               name total university specialist area_km2       pop
# 1         Xinjiang    54        18         36  1660000  21813334
# 2           Xizang     7         4          3  1228000   3002166
# 3     Inner Mongol    53        17         36  1183000  24706321
# 4            Gansu    49        22         27   454400  25575254
# 5           Yunnan    81        32         49   383300  45966239
# 6     Heilongjiang    81        39         42   473000  38312224
# 7            Jilin    62        37         25   187400  27462297
# 8         Liaoning   115        63         52   145900  43746323
# 9          Guangxi    78        38         40   236000  46026629
# 10       Guangdong   154        67         87   180000 104303132
# 11          Hainan    20         8         12    34000   8671518
# 12          Fujian    90        39         51   121300  36894216
# 13        Zhejiang   108        59         49   102000  54426891
# 14        Shanghai    64        39         25     6300  23019148
# 15         Jiangsu   167        77         90   102600  78659903
# 16        Shandong   146        70         76   153800  95793065
# 17           Hebei   122        61         61   187700  71854202
# 18         Tianjin    56        30         26    11300  12938224
# 19 Paracel Islands    NA        NA         NA       10        NA
# 20         Beijing    93        68         25    16800  19612368
# 21         Sichuan   126        52         74   481400  80418200
# 22       Chongqing    65        26         39    82300  28846170
# 23         Guizhou    72        29         43   176000  34746468
# 24           Hunan   125        51         74   211800  65683722
# 25         Ningxia    19         8         11    66400   6301350
# 26         Shaanxi    95        57         38   205600  37327378
# 27         Qinghai    12         4          8  1183000   5626722
# 28          Shanxi    82        33         49   156300  35712111
# 29         Jiangxi   103        45         58   167000  44567475
# 30           Henan   141        57         84   167000  94023567
# 31           Hubei   128        68         60   185900  57237740
# 32           Anhui   120        46         74   139700  59500510
# 33          Taiwan    NA        NA         NA    36000  23570000
univ_geo_df <- left_join(univ_data, cn_geometry, by = "name")  # just a data frame
univ_geo <- st_sf(univ_geo_df)  # change as a sf object
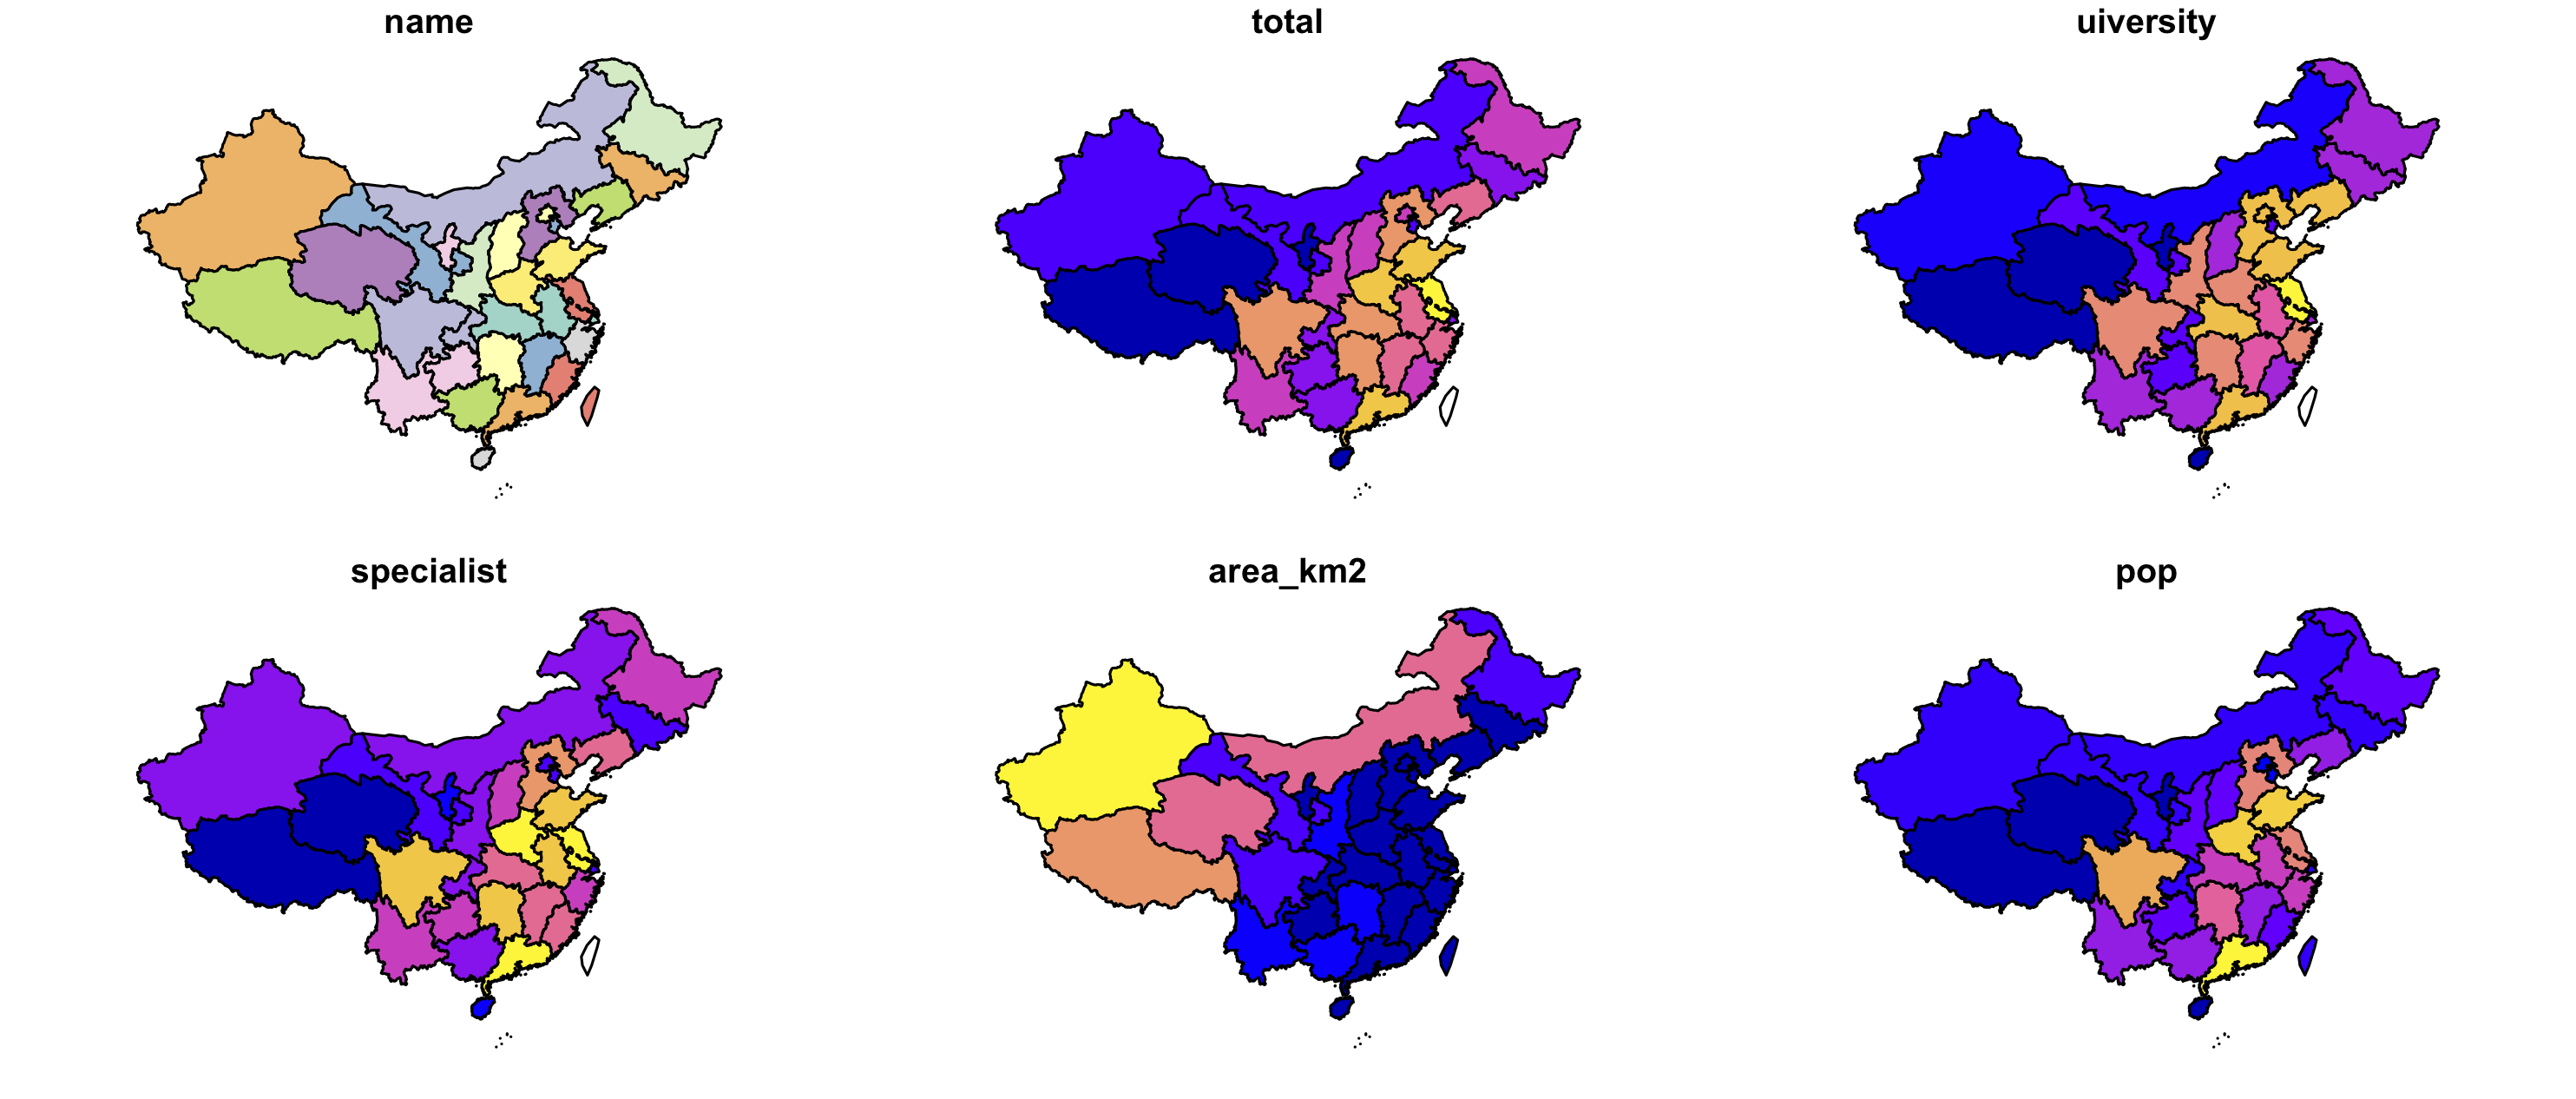
从上图即可对中国各省的高校数量、本科高校数量、专科高校数量、面积、人口的概况有所了解了。
Number of universities
To show the number of universities in China clearly, I use tmap package to plot the map.
首先看各省地区的大学数量分布(台湾高校跟大陆的毕竟不是一个系统,这里不做讨论)。
# only used object 'tw_sf_g' created above, the plot of Taiwan Province has the clear boundry
# Taiwan's attribute data is this:
taiwan <- univ_geo %>% filter(name == "Taiwan")

# Number of total
tm_shape(univ_geo) + tm_borders(col="white", lwd=0.3) + tm_fill(col="total", n = 7, breaks = c(0, 30, 60, 90, 120, 150, 180, 200), title = "Number")
  + tm_shape(tw_sf) + tm_borders(col="white", lwd=0.3) + tm_fill(col=taiwan$total)
  + tm_layout(title = "Number of total colleges in China")

# Number of university
tm_shape(univ_geo) + tm_borders(col="white", lwd=0.3) + tm_fill(col="university", n = 6, breaks = c(0,15,30,45,60,75,90), title = "Number")
  + tm_shape(tw_sf) + tm_borders(col="white", lwd=0.3) + tm_fill(col=taiwan$university)
  + tm_layout(title = "Number of universities (Banchelor) in China")
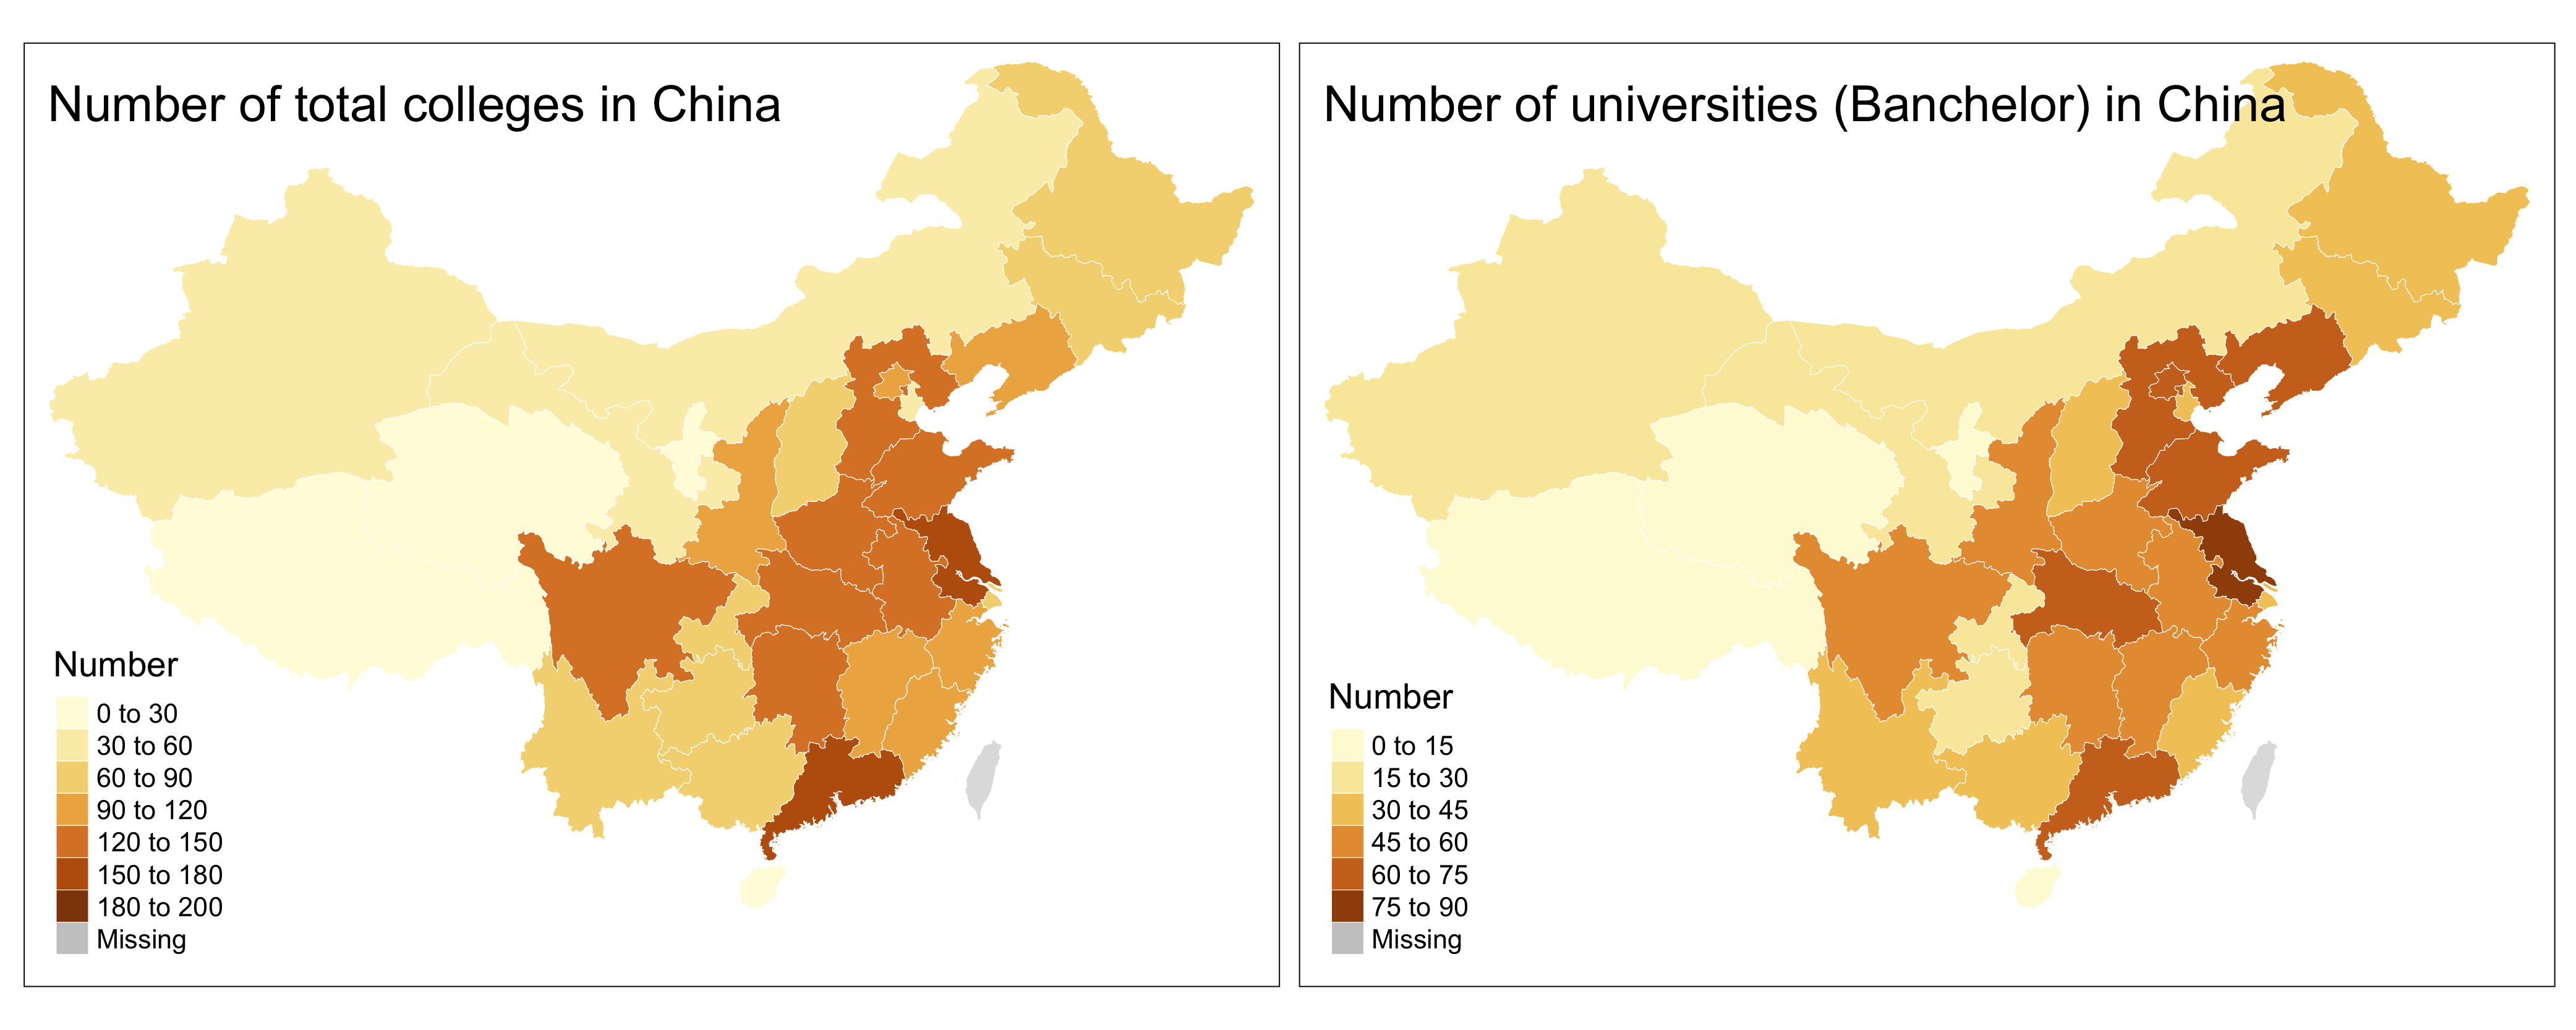
This map shows that the highest number of universities is Jiangsu. It is obviously that the West of China has much fewer universities than that in East of China. Total number in some province like Sichuan, Henan, Anhui, Hunan is high, butthe number of the universities (Banchelor) are oppositely fewer than other provinces such as Hubei, Shandong, Hebei, Liaoning, and Beijing. Maybe there are more colleges of specialist in the former provinces.
总体上看,西部地区的高校数量远远少于中东部。江苏省、广东省无疑是高校数量最多的两个省,北京、上海却没有想象中的那么多高校,当然这是因为这里讲的高校包括了本科、专科、公办、民办各个种类。要是单论知名或重点高校,当然北京上海最多。下面的分析中会体现出来。从高校总数上来看,四川、河南、安徽、湖南都较多,可是本科高校却抵不上山东、辽宁、河北、湖北、浙江等,因此可以说四川、河南这几个省的专科高校更多,整体高校水平并不高。
Density of universities
Here I plot the density of university per 10000 km2 in each province. The density of universities becomes a better measurement to reflect the higher education level.
如果计算单位面积上的高校数量,恐怕是另一种结果了。这一高校密度才是衡量这一地区高等教育水平的真实体现。
univ_geo2 <- mutate(univ_geo, univ_density = university / area_km2 * 10000, total_density = total/ area_km2 * 10000, popuniv_density = university / pop * 10000000, poptotal_density = total / pop * 10000000)
univ_geo2
# Simple feature collection with 33 features and 10 fields
# geometry type:  MULTIPOLYGON
# dimension:      XY
# bbox:           xmin: 73.60226 ymin: 15.77538 xmax: 134.7726 ymax: 53.56944
# epsg (SRID):    4326
# proj4string:    +proj=longlat +datum=WGS84 +no_defs
# First 10 features:
#            name total university specialist area_km2       pop                       geometry univ_density total_density popuniv_density poptotal_density
# 1      Xinjiang    54         18         36  1660000  21813334 MULTIPOLYGON (((78.95694 34...   0.10843373    0.32530120        8.251833         24.75550
# 2        Xizang     7          4          3  1228000   3002166 MULTIPOLYGON (((78.38098 32...   0.03257329    0.05700326       13.323714         23.31650
# 3  Inner Mongol    53         17         36  1183000  24706321 MULTIPOLYGON (((116.582 46....   0.14370245    0.44801352        6.880830         21.45200
# 4         Gansu    49         22         27   454400  25575254 MULTIPOLYGON (((96.36634 42...   0.48415493    1.07834507        8.602065         19.15915
# 5        Yunnan    81         32         49   383300  45966239 MULTIPOLYGON (((102.1187 22...   0.83485520    2.11322724        6.961631         17.62163
# 6  Heilongjiang    81         39         42   473000  38312224 MULTIPOLYGON (((123.2773 53...   0.82452431    1.71247357       10.179519         21.14208
# 7         Jilin    62         37         25   187400  27462297 MULTIPOLYGON (((131.2528 43...   1.97438634    3.30843116       13.473017         22.57641
# 8      Liaoning   115         63         52   145900  43746323 MULTIPOLYGON (((125.7041 40...   4.31802605    7.88211103       14.401210         26.28792
# 9       Guangxi    78         38         40   236000  46026629 MULTIPOLYGON (((105.665 23....   1.61016949    3.30508475        8.256090         16.94671
# 10    Guangdong   154         67         87   180000 104303132 MULTIPOLYGON (((114.2298 22...   3.72222222    8.55555556        6.423585         14.76466
# The unit of univ_density is 'university/10 thousand km2'
# The unit of popuniv_density is 'university/10 million people'
For the densitys in Shanghai, Beijing, Tianjin, Jiangsu are much larger than any other provinces, in order to display the color legend more clearly, I split the density data into two parts (0~20 and 20~110) in following maps.
高校密度的计算结果反映出,上海、北京、天津、江苏远远高于其他省份。为了在地图上将不同颜色更清晰的显示,这里将密度结果分为两类,即0~20为一类,20~110为一类。
# The attribute data of Taiwan
taiwan_density <- univ_geo2 %>% filter(name == "Taiwan")

# Total density
totalden_few <- univ_geo2 %>% filter(total_density < 20)
totalden_many <- univ_geo2 %>% filter(total_density >= 20)
tm_shape(totalden_few) + tm_borders(col = "gray40", lwd = 0.1) + tm_fill(col = "total_density", n = 5, breaks =c(0, 4, 8, 12, 16, 20), title = expression("Number/10000km"^"2"))
  + tm_shape(totalden_many) + tm_borders(col = "gray40", lwd = 0.1) + tm_fill(col = "total_density", palette = colorRampPalette(c("#d73968", "#431a28"))(256), n = 5, breaks=c(20, 40, 60, 80, 100, 110), title = "")
  + tm_shape(tw_sf) + tm_borders(col = "gray40", lwd = 0.1) + tm_fill(col = taiwan_density$total_density)
  + tm_layout(title = "Density of total in China")

# Density of university
univden_few <- univ_geo2 %>% filter(total_density < 10)
univden_many <- univ_geo2 %>% filter(total_density >= 10)
tm_shape(univden_few) + tm_borders(col = "gray40", lwd = 0.1) + tm_fill(col = "univ_density", n = 7, breaks =c(0,1.5,3,4.5,6,7.5,9,10), title = expression("Number/10000km"^"2"))+ tm_shape(univden_many)
  + tm_borders(col = "gray40", lwd = 0.1) + tm_fill(col = "univ_density", palette = colorRampPalette(c("#d73968", "#431a28"))(256), n=3, breaks=c(10,30,50,70), title = "")
  + tm_shape(tw_sf) + tm_borders(col = "gray40", lwd = 0.1) + tm_fill(col = taiwan_density$univ_density)
  + tm_layout(title = "Density of universities (Banchelor) in China")
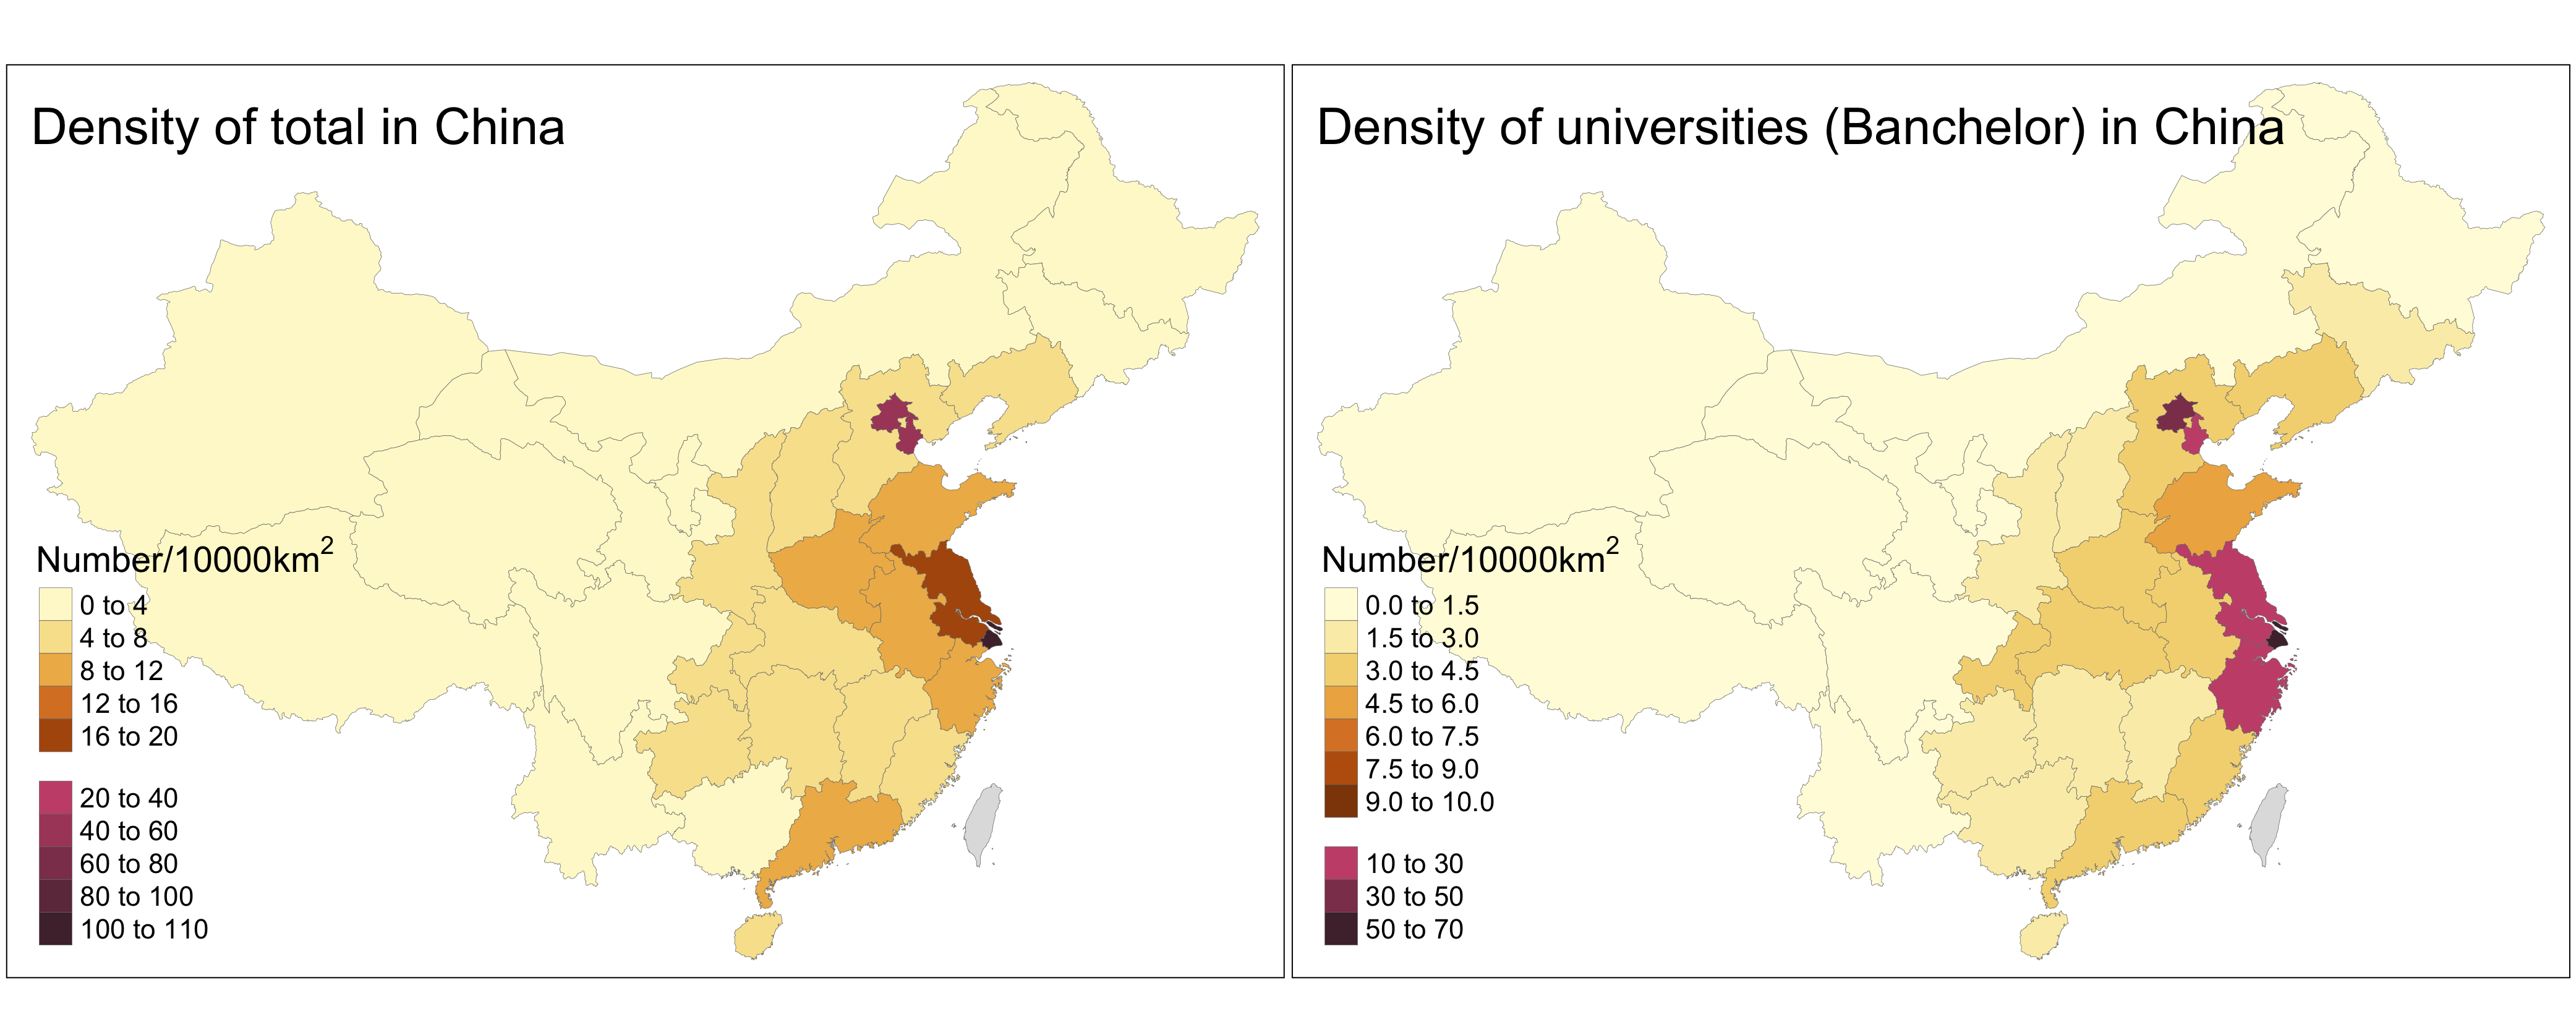
In these two plots, it is obvious that Shanghai, Beijing, Tianjin, Jiangsu, and Zhejiang have higher density of banchelor universities. The East of China has the most higher education resources. The Middle of China has fewer, and the West of China has the fewest higher education resources. We also can image that the specialist colleges in Henan, Anhui, Guangdong are more, because their density is the same with some of others (e.g. Zhejiang, Shandong) in total, but becomes smaller than that in banchelor universities. Although they have high density in total, but the quality of university is lower than that of Shanghai, Beijing, et al.
很显然,当计算高校的密度时,上海、北京、天津、江苏、浙江,这几个沿海发达地区无疑拥有最好的高等教育资源。山东也不错。而河南、广东安徽貌似专科学校更多,因为这几个省总数挺多的,但是本科高校的密度相比之下却低了一个层次,因此可以说这几个省总数虽多,但质量却远远不比上海、北京等。
Number of universities per 10 million people
Then I plot the map of the number of universities per 10 million people.
那么人均(这里以1000万人为基准)高校数量是不是也跟高校密度的表现是一样的呢?
# Total
tm_shape(univ_geo2) + tm_borders(col = "gray40", lwd = 0.1) + tm_fill(col = "poptotal_density", title = "Number/10 M people")
  + tm_shape(tw_sf) + tm_borders(col = "gray40", lwd = 0.1) + tm_fill(col = taiwan_density$poptotal_density)
  + tm_layout(title = "Number of total colleges per 10 M people")

# University (Banchelor)
tm_shape(univ_geo2) + tm_borders(col = "gray40", lwd = 0.1) + tm_fill(col = "popuniv_density", title = "Number/10 M people")
  + tm_shape(tw_sf) + tm_borders(col = "gray40", lwd = 0.1) + tm_fill(col = taiwan_density$popuniv_density)
  + tm_layout(title = "Number of universities (Banchelor) per 10 M people")
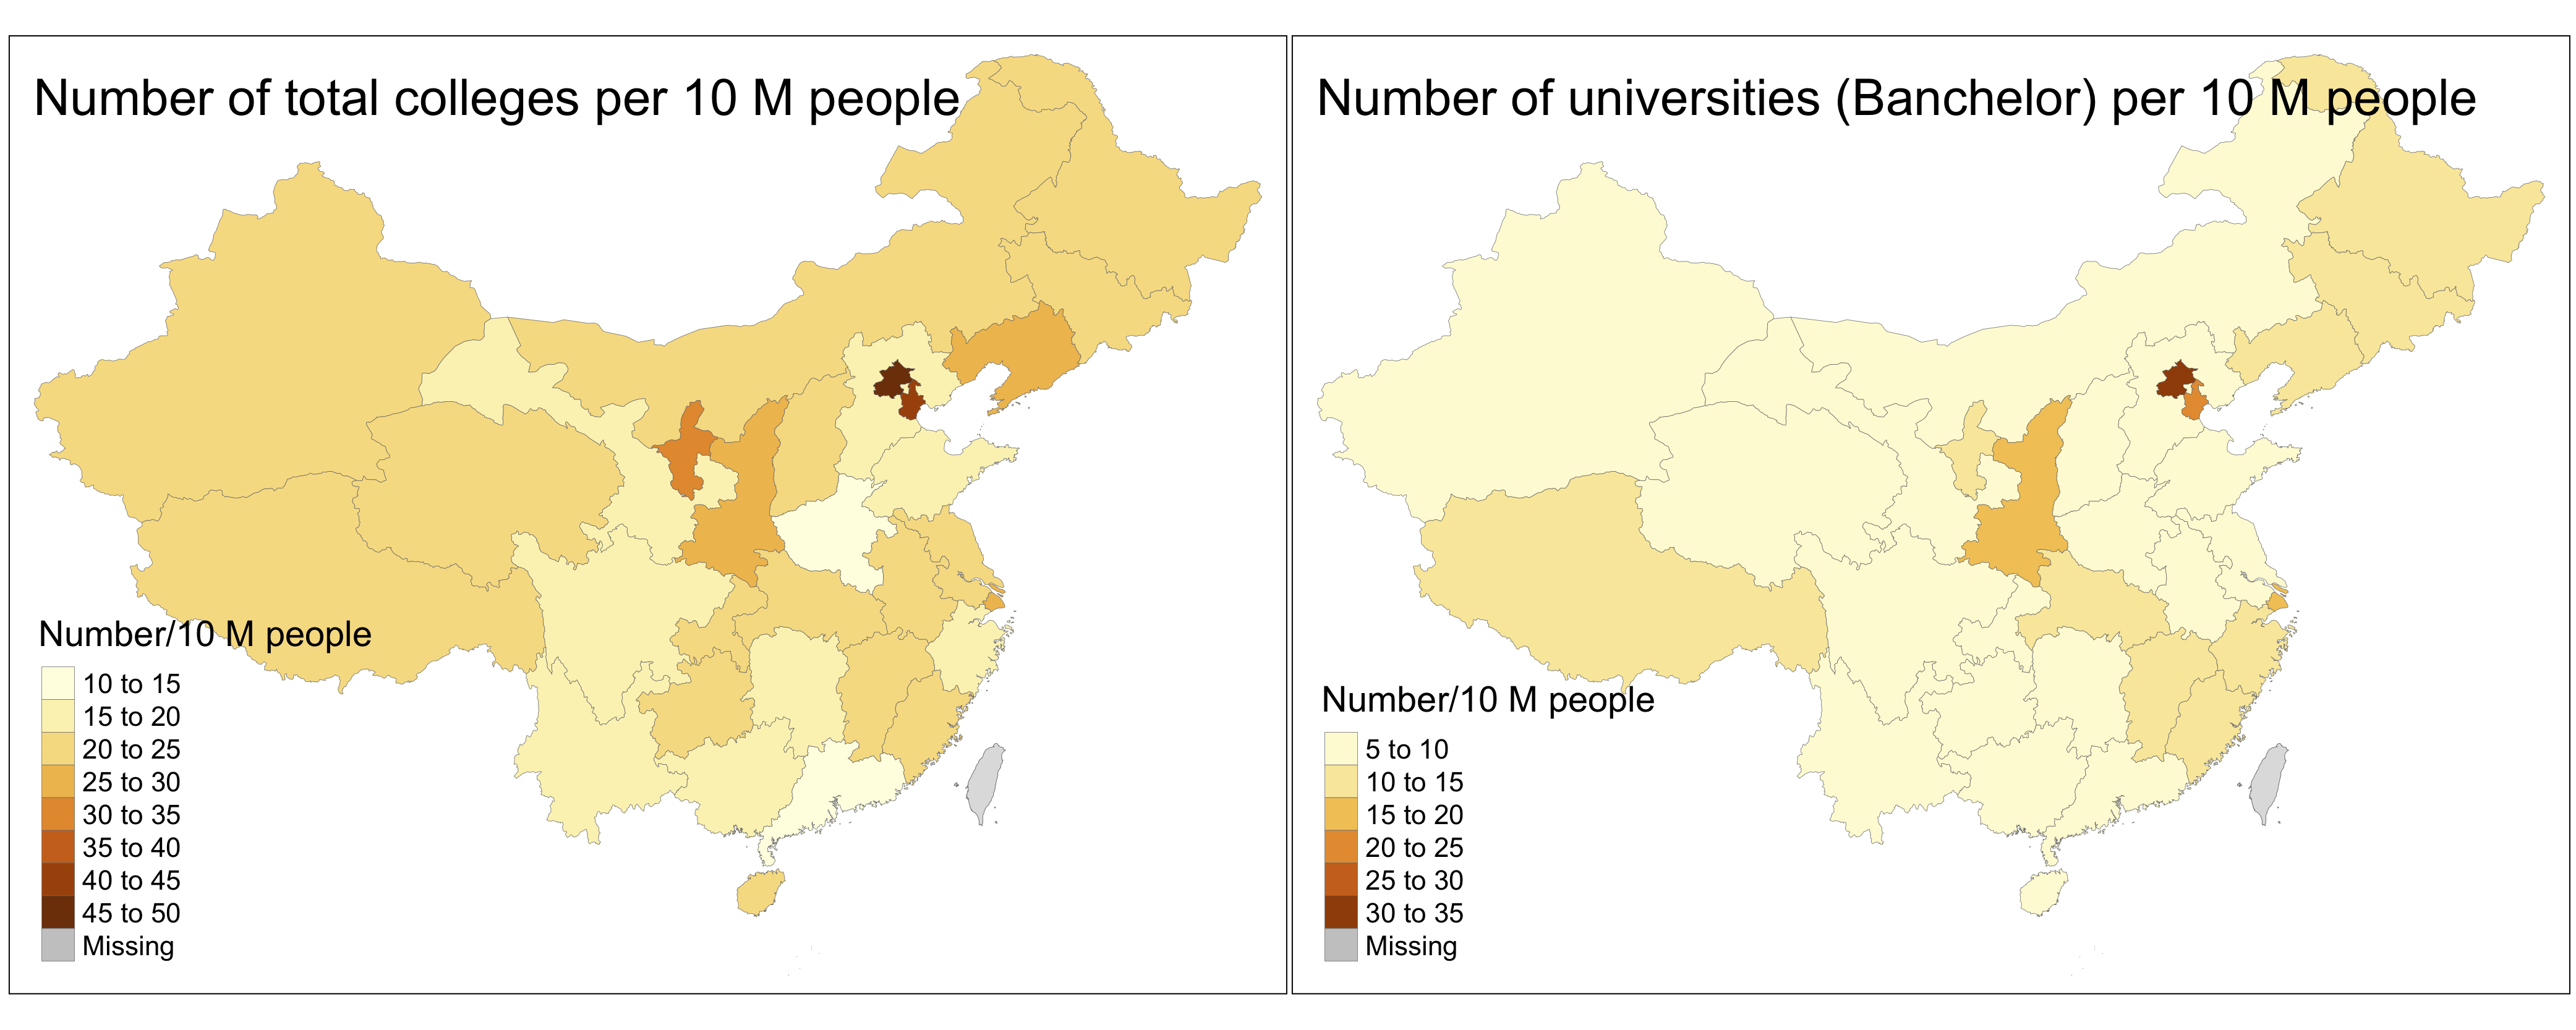
The two plots show the result that people in Beijing, Tianjin, Shanghai, and Shaanxi have much more higher education resources than other provinces. For the number of colleges per 10 million people, especially for specialist colleges, the West of China is not the worst part. In the contrast, Henan is the worst situation! Henan has few good universities but has large populations, though its total number of colleges is not so few!
每千万人享有的高等教育水平,很明显最高值分布在北京,其次是天津、上海、陕西。东北、西部地区可以说每千万人享有的高等教育水平都不算少,即人均享受的高等教育比河南要高多了!河南才是这里最惨的,其知名或重点的本科院校太少,再加上其庞大的人口基数,人均享受的高等教育太低了!虽然河南的高校总数仅次于江苏和广东,但是人均值太低了!
数据不会说谎,再一次证明,河南的高等教育发展需要国家更多的重视和投入!